

Monitor Your Services Uptime Using Uptime Kuma
Uptime Kuma is a feature-rich yet simple to use uptime monitoring tool. It will allow you to monitor your servers and services uptime and also notify you in case of downtime.
TLDR (Too Long Didn’t Read!)
Docker approach:
# Install Docker CE

docker volume create uptime-kuma

docker run -d --restart=always -p 3001:3001 -v uptime-kuma:/app/data --name uptime-kuma louislam/uptime-kuma:1
Non-docker approach:
# Install nodejs and npm

# Update npm
sudo npm install npm -g

git clone https://github.com/louislam/uptime-kuma.git
cd uptime-kuma
npm run setup

sudo npm install -g pm2
pm2 start server/server.js --name uptime-kuma
Step-by-Step Installation Guide
Installing, or rather, deploying Uptime Kuma using Docker is the easiest method as you won’t need to take care of extra dependency. Just run the crafted docker CLI command, and you’re all set!
But I will also explain how to deploy it using NodeJS plus PM2! So, you can choose which method fits you.
Prerequisites
For both approaches, allow port 3001 from your OS firewall and/or your active ServerStadium Security Profile.
Via Docker
Step 1:
Install docker of course! You can follow the guide here.
Step 2:
Create a docker volume to ensure persistent data
docker volume create uptime-kumaStep 3:
Run uptime-kuma
docker run -d --restart=always -p 3001:3001 -v uptime-kuma:/app/data --name uptime-kuma louislam/uptime-kuma:1Step 4:
Make sure uptime-kuma is running!
docker psStep 5:
Proceed to the First setup section!
Non-docker deployment
Uptime Kuma requires nodejs version >= 14, git and npm.
Step 1: Installing nodejs package
For RHEL/CentOS/Alma/Rocky 8
Check dnf module for nodejs
sudo dnf module list nodejs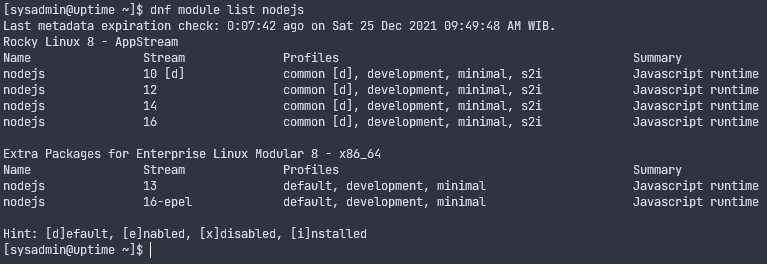
In this article, I will install version 16:
sudo dnf module install nodejs:16For Ubuntu 20.04
Pull the NodeSource PPA. If you wish to install another version, replace the “16” below with any version you want to install:
curl -sL https://deb.nodesource.com/setup_16.x -o nodesource_setup.shThen, execute the script:
sudo bash nodesource_setup.sh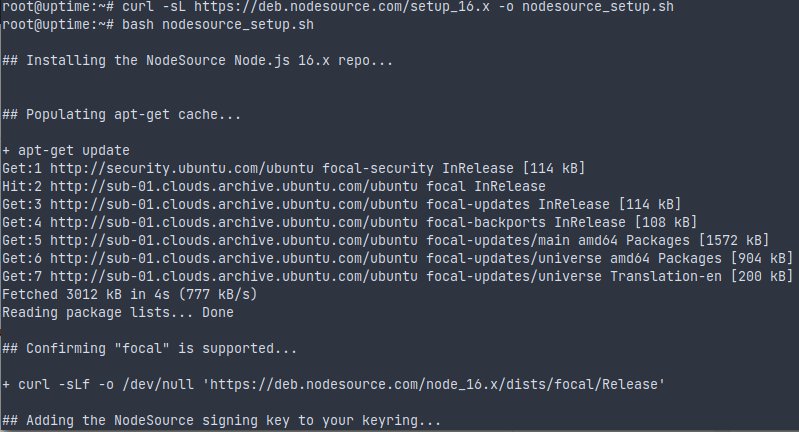
Lastly, install nodejs
sudo apt install nodejs -yStep 2: Building Uptime Kuma
This part and beyond would work for whichever Linux distro you’re using.
Pull Uptime Kuma repo and then enter the cloned directory:
git clone https://github.com/louislam/uptime-kuma.git
cd uptime-kuma
After that, run the following command to start building Uptime Kuma:
npm run setup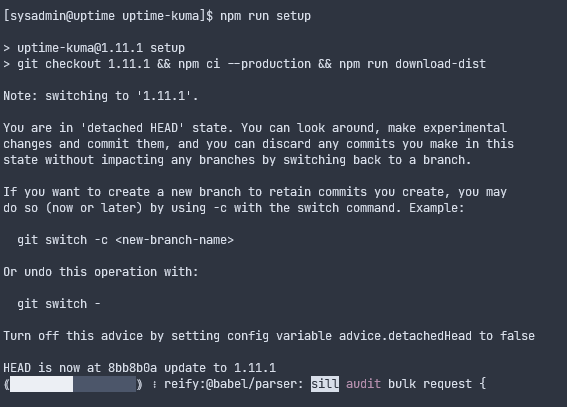
Once it’s done, test it!
node server/server.jsIf it outputs something like this, then the setup is good.
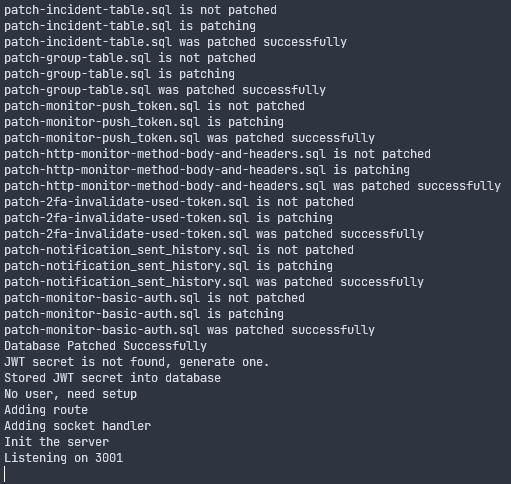
Exit it by pressing CTRL+C. Next, we will run it with pm2 so it would run in the background.
Step 3: Setup pm2
Install the PM2 module via npm
sudo npm install -g pm2Then, run the following command. Make sure you run it in the uptime-kuma directory:
pm2 start server/server.js --name uptime-kumaCheck if it’s running well in the background by pm2 status command:

First time setup
Yay, now it’s ready! Access your Uptime Kuma via http://YOUR-IP:3001
The URL looks ugly, right? If you want to get rid of it and use SSL to make it more secure, use a reverse proxy. You can read this article on how to use Nginx Proxy Manager to manage this kind of hassle easily.
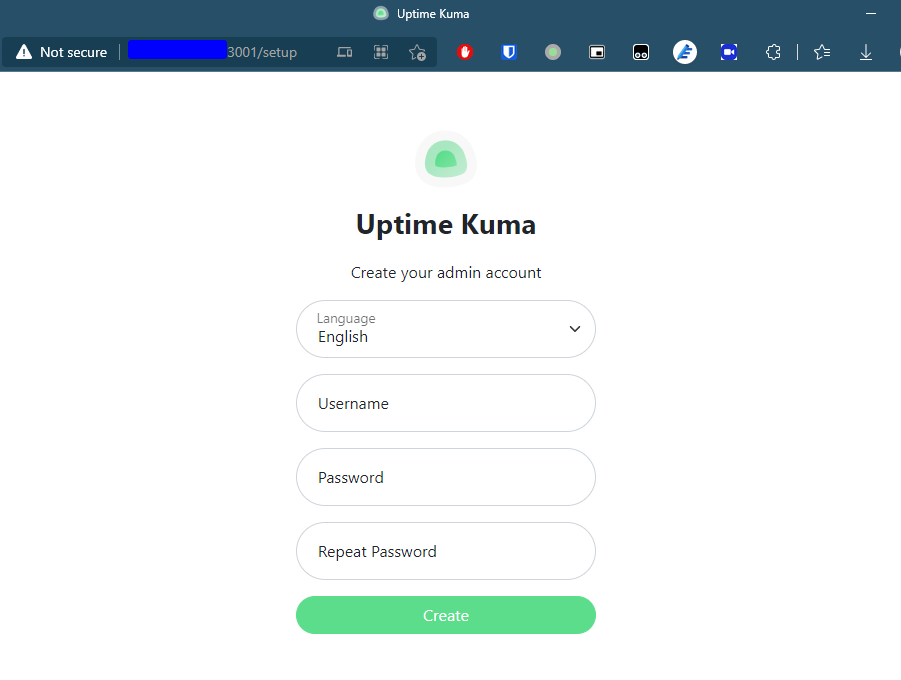
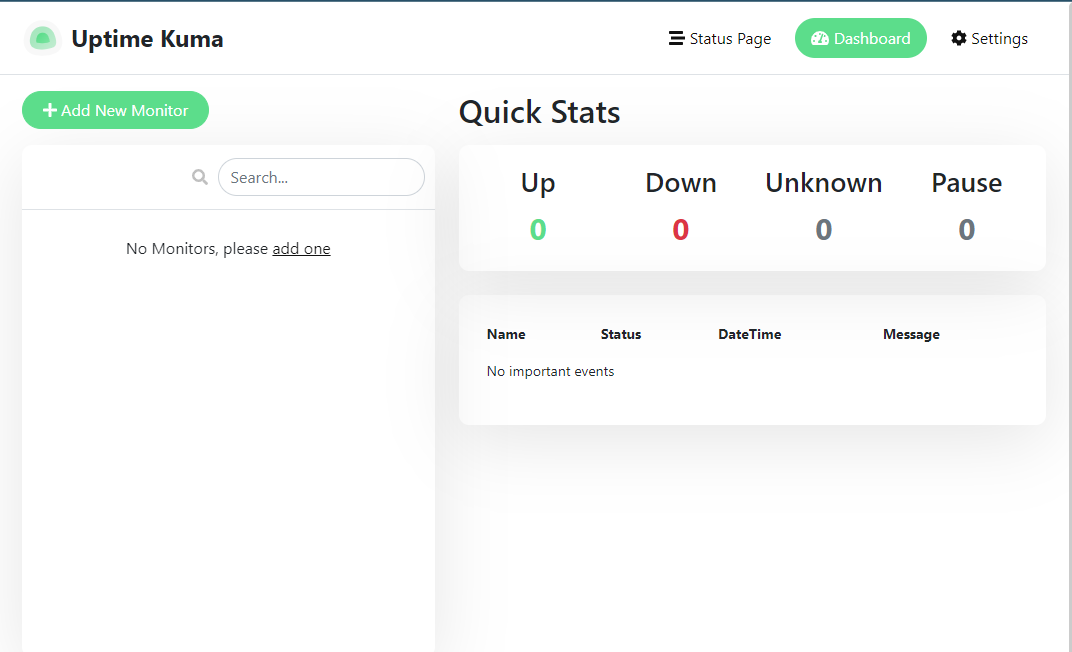
Create your admin user with a strong and complicated password. Then you’ll be brought to this page:
Proceed to the next section!
Adding monitor
Uptime Kuma supports various types of monitoring. Here, I will cover most of them.
Basic HTTP(s)
Basic HTTP/HTTPS monitoring, as the title describes it, monitors basic HTTP/HTTPS connection. Uptime Kuma simply tries to reach the designated website, and it will report if it’s reachable and the latency.
Step 1. On the dashboard, click Add New Monitor
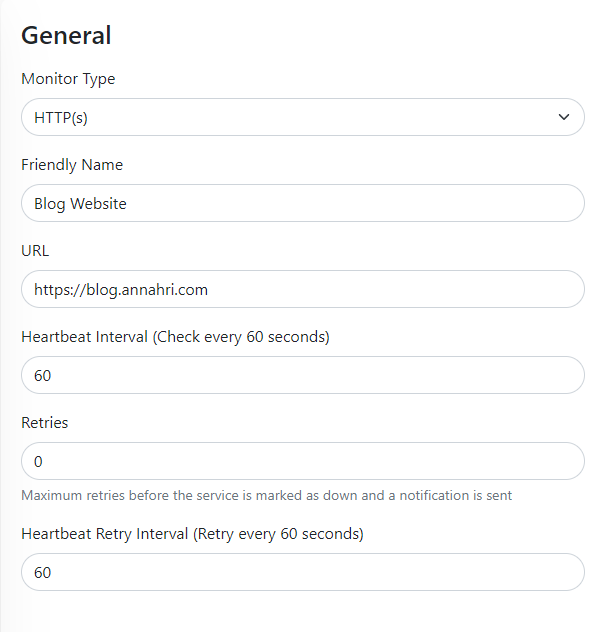
Step 2. Select HTTP(s) for the monitor type.
Step 3. Give it a friendly name, e.g. My Blog Website
Step 4. Specify the URL
Step 5. Set the checking interval.
Step 6. Set the number of retries before Uptime Kuma sends a notification/alert.
Step 7. Set the retry check interval. When a monitor is reported down, this interval will override the previous checking interval.
Last step. Save!
In the Advanced section, an option allows you to flip the status. So, when the website is reachable, then it’s considered DOWN and will be alerted. Also, you can set the maximum redirects. Lastly, specify the status code it should return and consider it UP.
HTTP(s) keyword
Keyword monitoring will monitor a web page and find a specific keyword, not the HTTP service itself. When the keyword is not present, then the website is considered DOWN. This will allow you to quickly notice if your website is being defaced, hacked, or if something unexpected happens to the page.
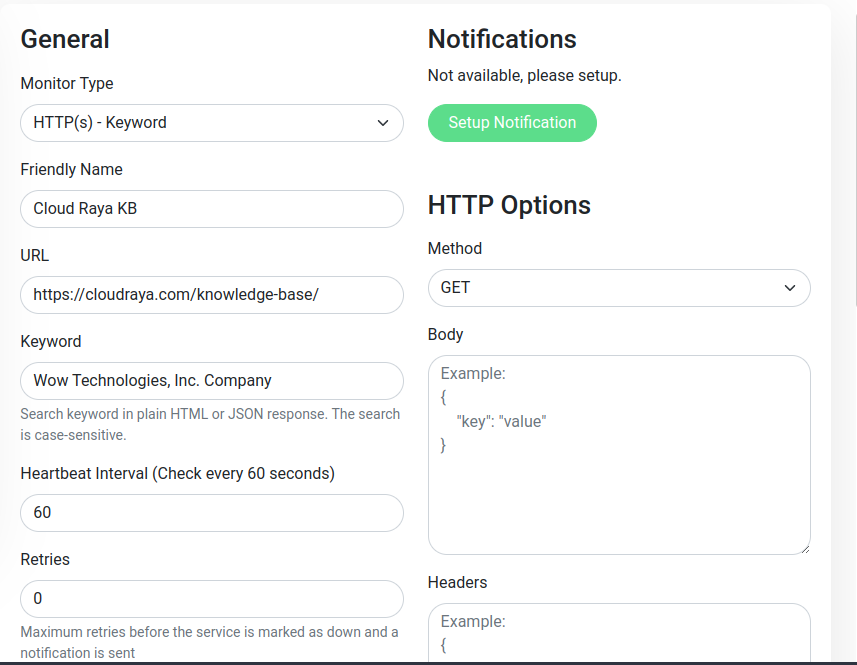
The steps are similar to the previous one, but you’ll need to specify which keyword should be present on the webpage/site.
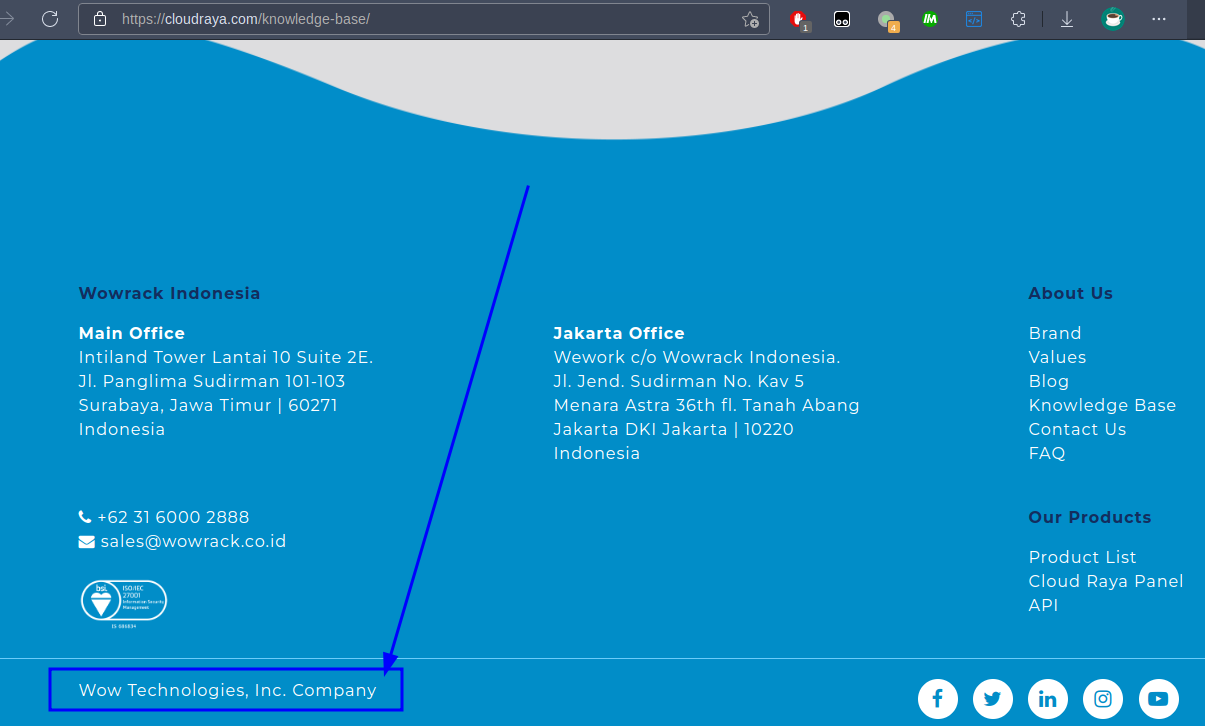
For example, on the ServerStadium KB page, the footer has a text which says “Wow Technologies, Inc. Company” and we want to monitor that.
The configurations are as follows:
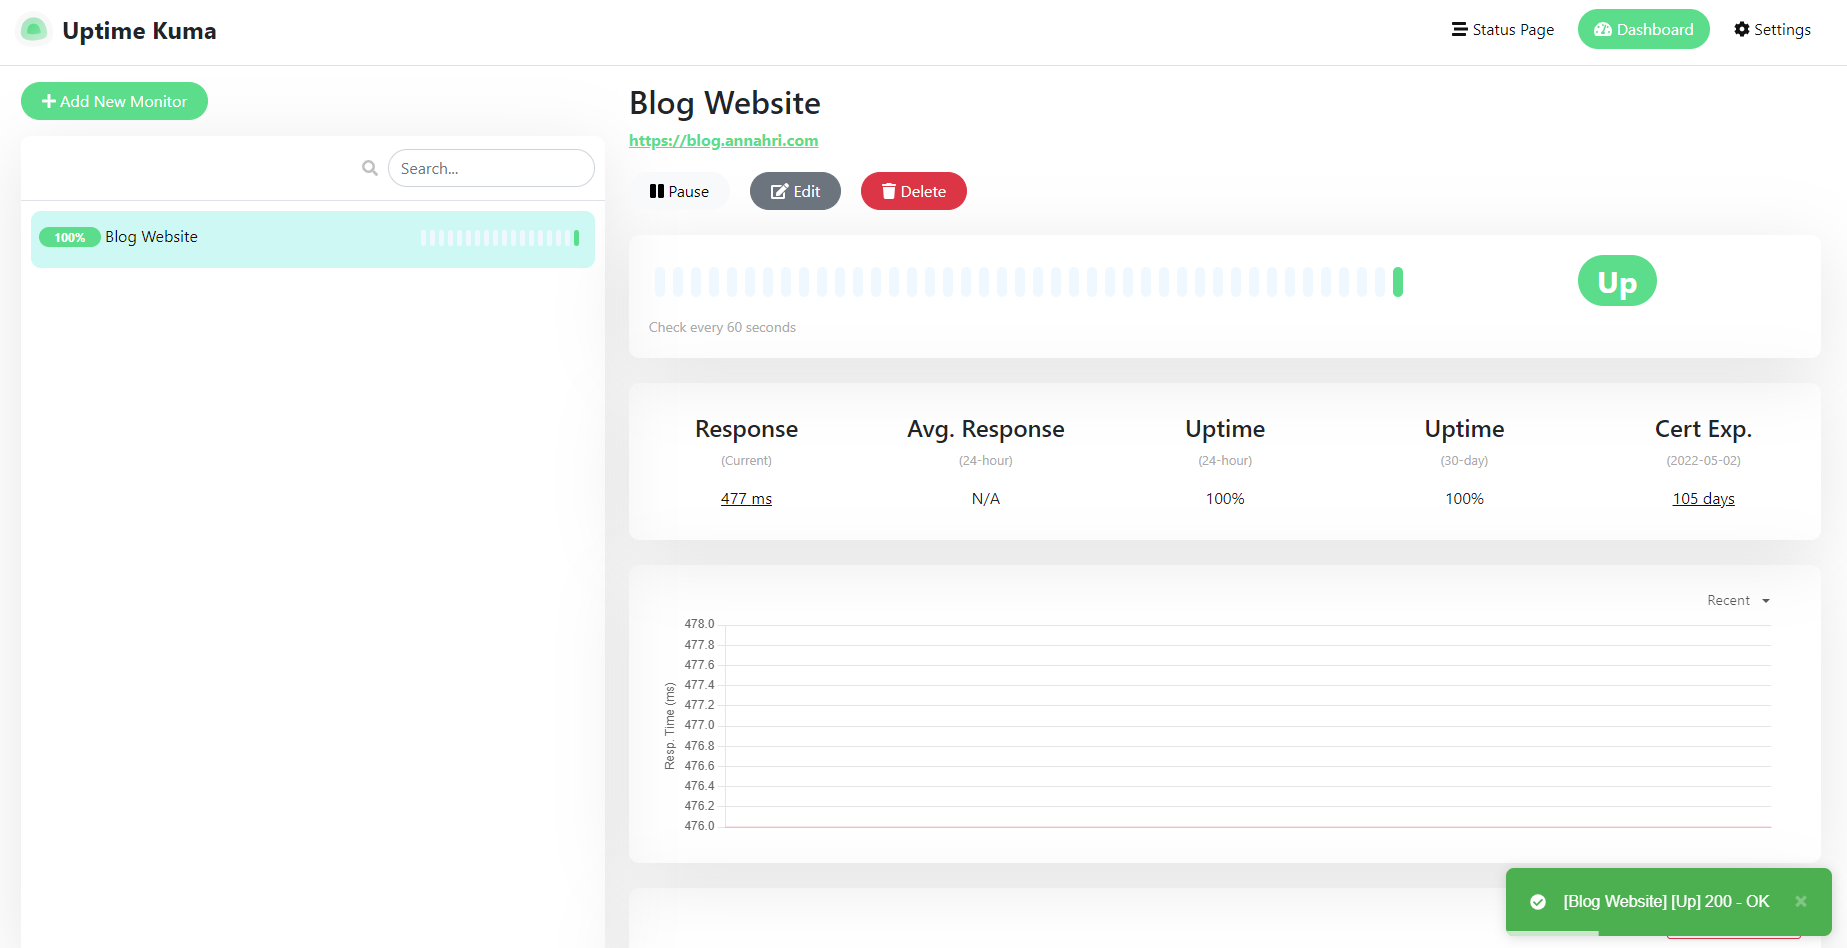
Then if you click Save, a green notification will pop up and says that the keyword is found! And the monitor states UP.

TCP port
This will monitor a specific port from a given server. Good use of this will be to monitor if certain services are down. For example, you will know that your SMTP service is down when the designated port is no longer open to the public, or any management ports or anything, you name it.
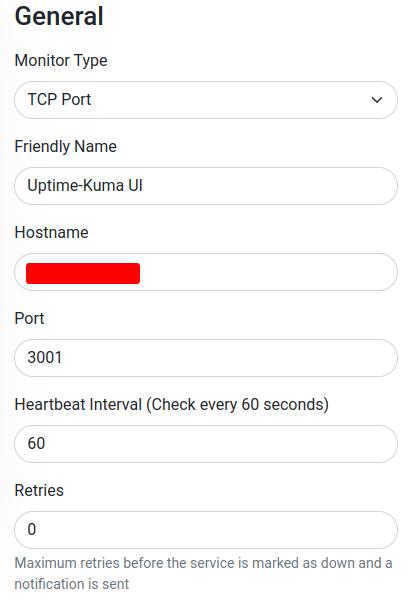
Follow the steps from the Basic HTTP monitoring part until step 3. Then fill in the Hostname field with the desired server and the port with the TCP port to be monitored.
Ping
Self-explanatory, it will monitor the host by sending it ping probes. The simplest monitoring types. You’ll only need to fill in the server host/IP.

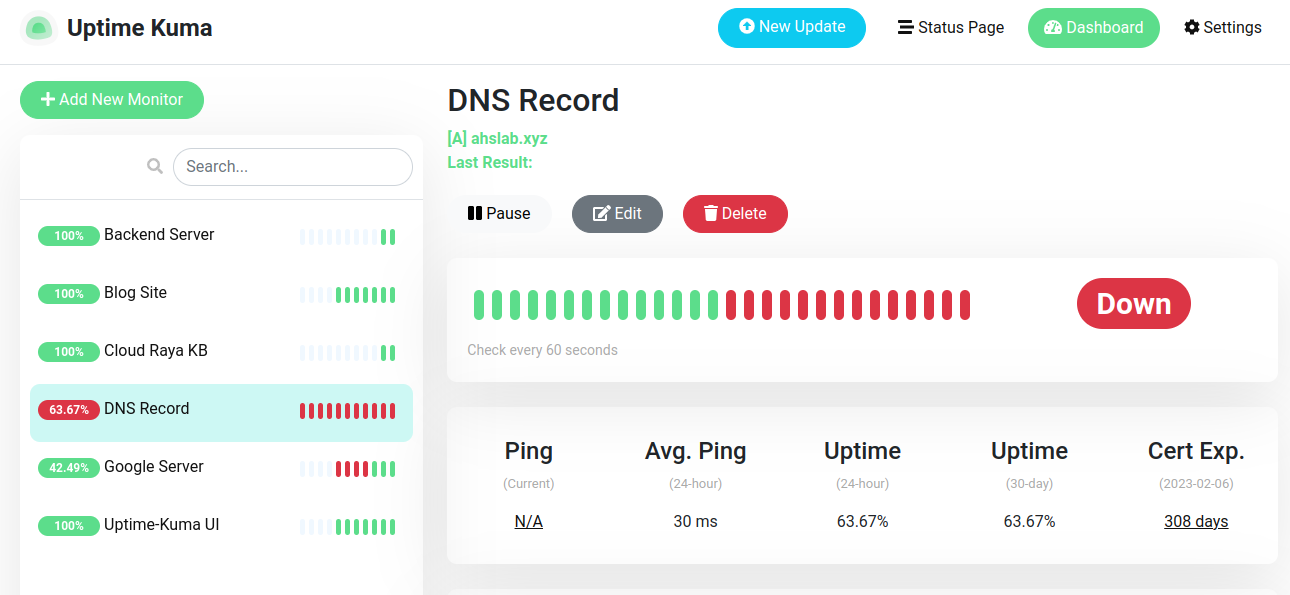
DNS record
DNS monitoring allows you to monitor a given DNS record. Whether it’s A, MX, CNAME, TXT, or any record type, you can quickly take action if your DNS records are no longer propagated, somehow.
Step 1. Set the monitoring type to DNS
Step 2. Always specify a friendly name.
Step 3. Specify the hostname. E.g. google.com
Step 4. Specify the resolver address. You can choose any DNS server, e.g. Cloudflare’s 1.1.1.1 or Google’s 8.8.8.8
Step 5. Specify which DNS record you want to monitor.
And the rest would be the same as the other monitoring types.
Push monitoring
You can monitor any servers that aren’t reachable from the internet but can reach the internet. Servers behind NAT, or having outgoing internet access only using a proxy for instance.
Simply put the Push URL in a cron job on a minute basis, and you’re all set.
Cronjob example:
* * * * * /usr/bin/curl -s 'http://HOSTNAME:3001/api/push/RGjeIGaV9p?msg=OK&ping='Setting up notifications
Uptime Kuma supports a variety of notification types. But here, I will explain only email and telegram notifications.
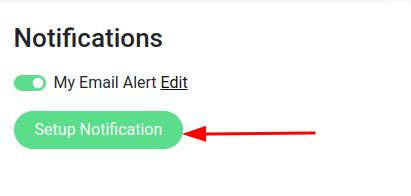
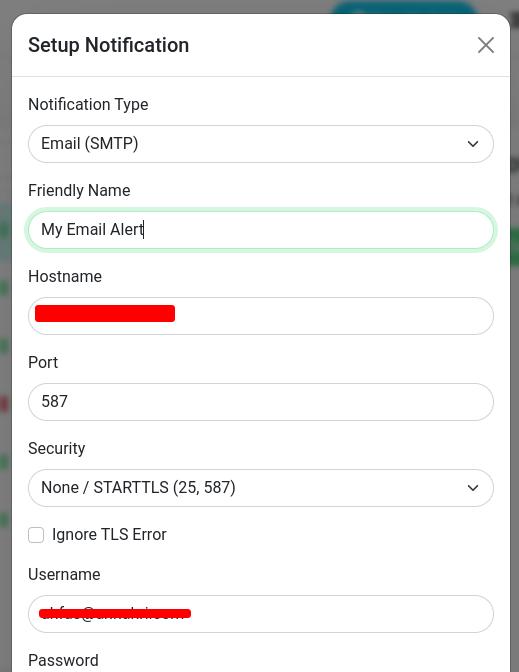
Email notification setup is pretty straightforward. You’ll only need to set up SMTP credentials, like when connecting with a mail client.
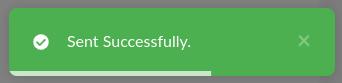
After filling in the required information, press the test button to check if the credentials are correct:
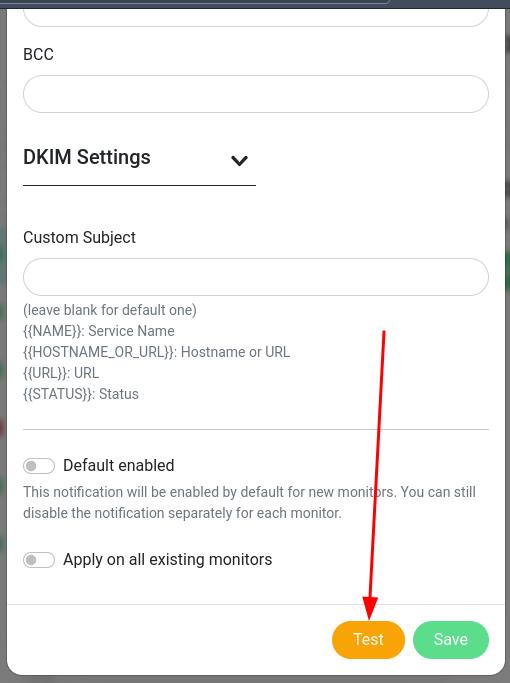
It will show a green notification box in the corner if Uptime Kuma can connect
Otherwise, it will throw an error and explain why it fails to connect. Next, check your mailbox for the test email.
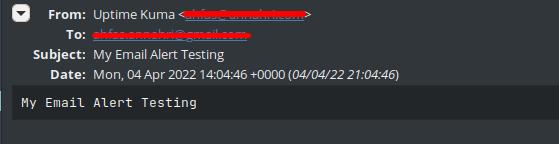
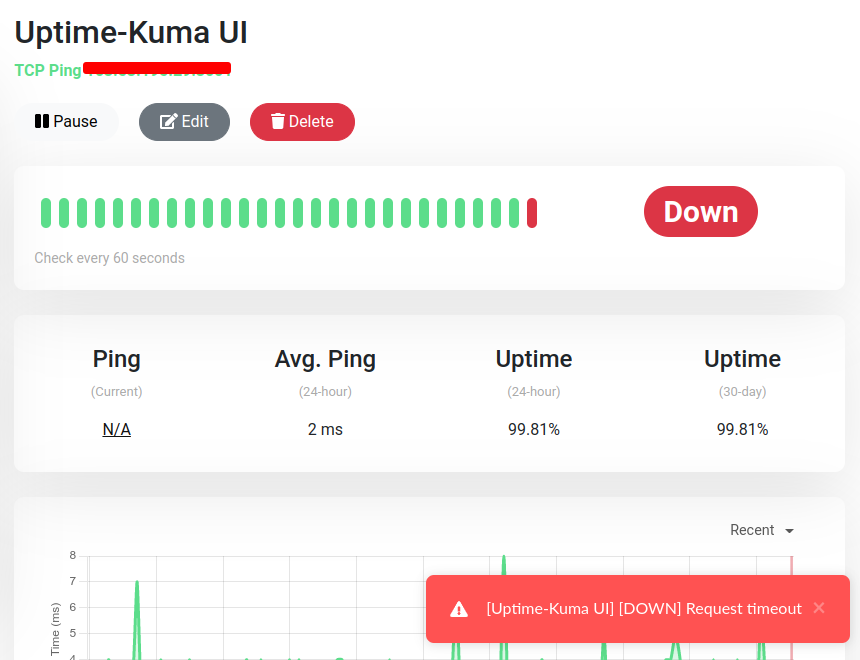
Then, try to make a fake downtime by setting an invalid hostname/port (or any parameter) so it will send an alert.

Check your mailbox; you should receive an alert for it!
Tada!
Telegram
Telegram notification setup will require you to prepare the following elements:
- Creating a Telegram BOT
- Direct Chat/Group/Channel Chat ID
Creating a Telegram BOT
Open your Telegram app (Mobile or PC), and search for @botfather. Be careful of any fake botfather accounts; make sure it’s exactly @botfather and has a verified icon on the name.
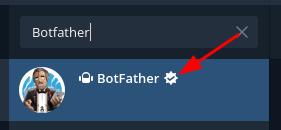
Then add the bot and start creating a bot.
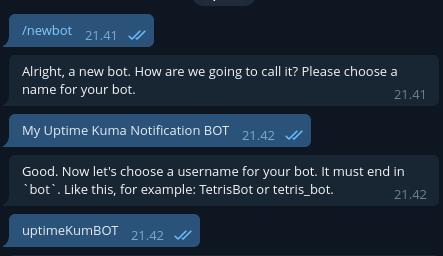
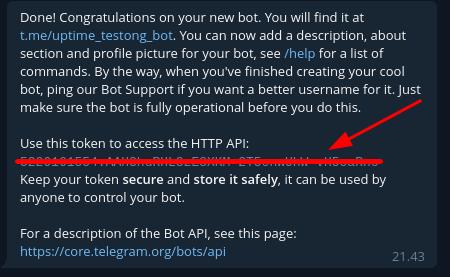
In the end, the BotFather will give you the API token you will use in Uptime Kuma. Keep it safe, and don’t share it with anybody.
The first part is done; let’s go to the second one.
Obtaining the Chat ID
A chat ID is the ID of a direct chat or channel or group where you want Uptime Kuma to send the notification. To get this ID, you’ll need to determine whether you want a group, a private channel, or just a plain chat (the bot will send the notification directly to your telegram account, not via group/channel).
If you create (or existing) a group or channel, you must invite the bot to the group/channel and assign writing permission to it. So, the bot will be able to post the notifications.
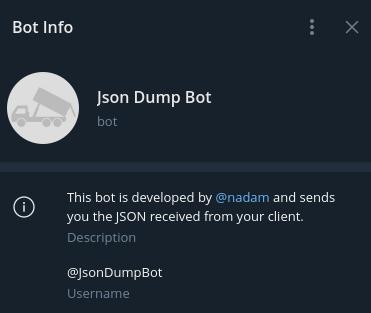
Then, add another bot called @JsonDumpBot that allows you to retrieve metadata of a message, including the chat ID, by simply forwarding the message to this bot.
First, post a dummy text in the group/channel or your own bot, then forward the message to the JsonDumpBot. You’ll be replied with the metadata in JSON format.
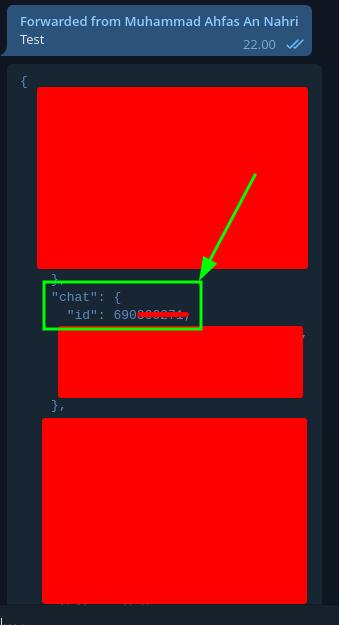
Find the part where it says “chat” and “id”. Then, you get the chat ID.
Notification setup
Back to Uptime Kuma, create a new notification setup and choose Telegram as the type. Fill in the required information.
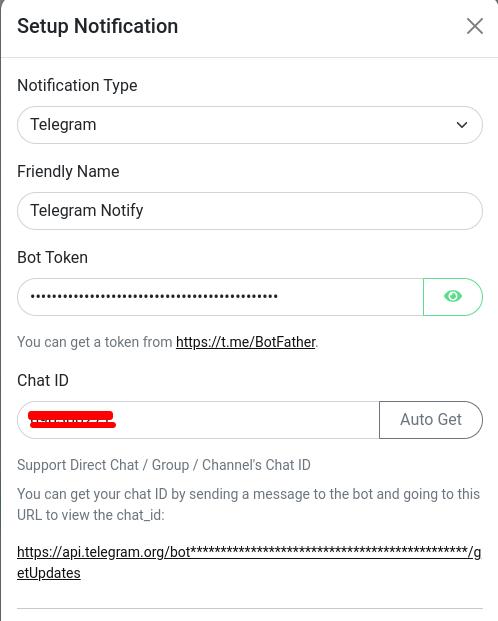
Test the notification as always. If you set it up correctly, it will send you the test notification.
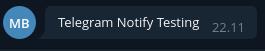
Done! The telegram notification is now ready! Yay! Now, do the real test just like the email one.
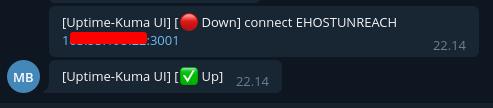
It’s awesome! Isn’t it?
Conclusion
To sum up, deploying Uptime Kuma is quick and easy. Also, adding monitors and configuring notifications are simple, thanks to its user-friendly interface.
Find more tech insight and tutorial articles in our Knowledge Base. Have you not tried ServerStadium’s panel yet? sign up here, and experience ServerStadium’s simplicity.